
A drive recorder that replays the route, not just the destination.
Every drive the speedometer records becomes a route you can play back at up to 16x, with the speed at every point, the corners marked, charts beneath the map, and a history that keeps all of them on the phone.
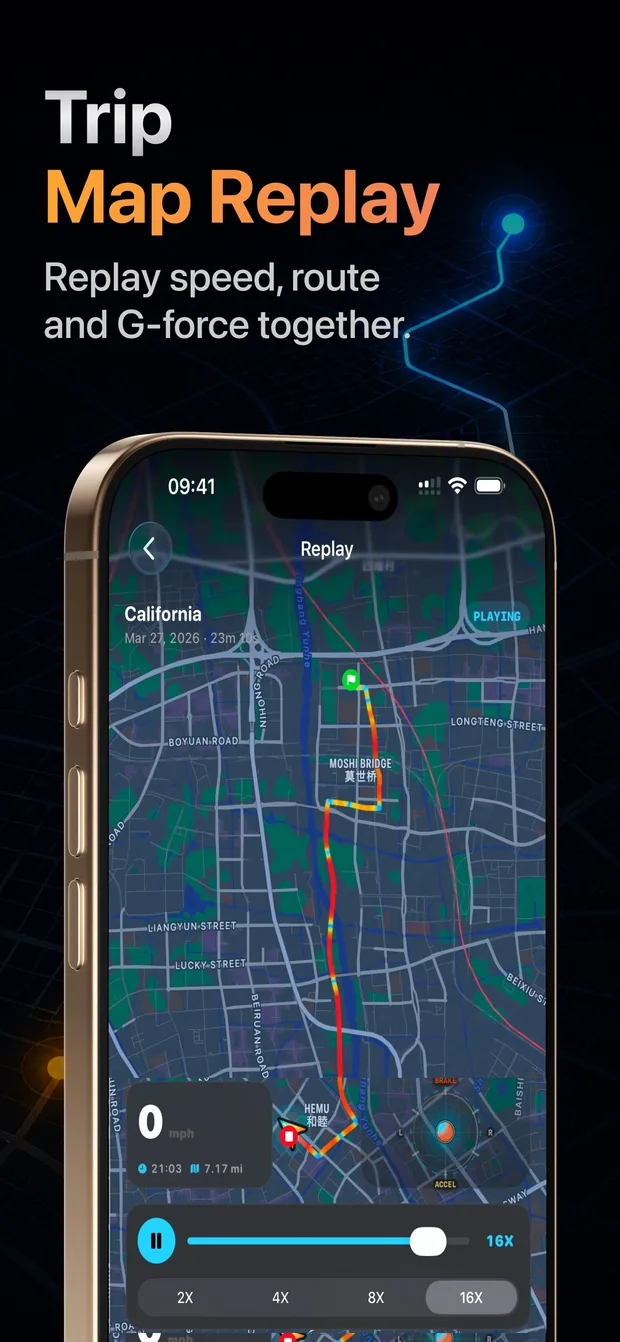
Watch the drive back at 2x to 16x.
Press play and a marker traces the route while the speed, elapsed time and distance count up beside it. Playback runs at 2x, 4x, 8x or 16x; the default picks 4x for a short drive and 16x for a long one, so a commute replays in about two minutes.
The route line is a speed heat map: blue where the drive was slow, through cyan and yellow, to red where it was fastest. Switch the color mode to road quality, G-force or elevation and the same line tells a different story.
- Scrub anywhere on the timeline; the marker and the readouts follow.
- Corners are marked on the route with their rating, so a canyon road reads as a string of letters.
- A live version of the same map follows the car during the drive, with a re-center button.
Speed and elevation against time.
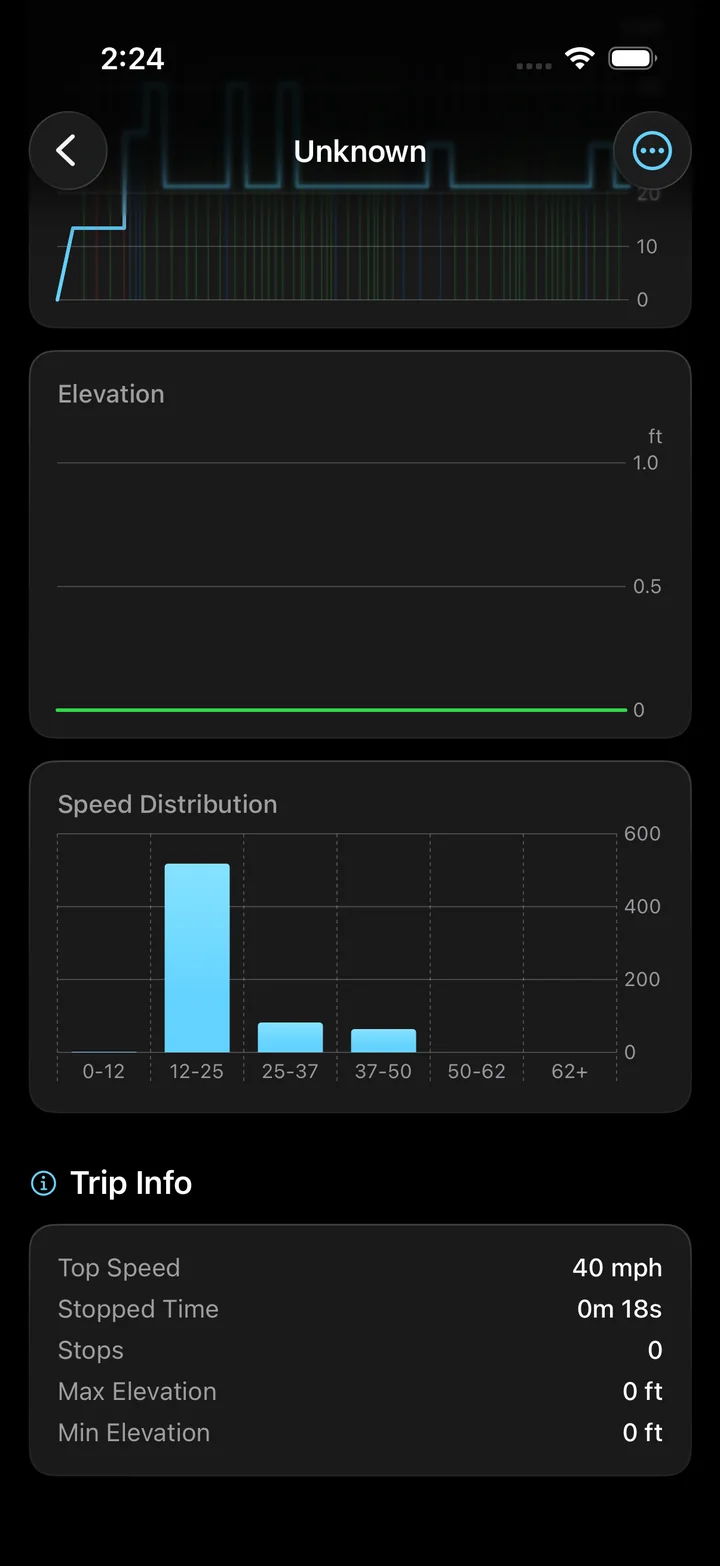
Under the map: a speed chart and an elevation chart against elapsed time, and a speed distribution showing how much of the drive was spent in each 20 km/h band. Scrub the speed chart and the map marker moves to that moment.
The elevation comes from the barometer with the GPS altitude as a check, so a mountain road's climb is a clean line rather than GPS altitude noise.
Match a climb total to the part of the elevation chart it describes. Elevation gain vs altitude
Inspect the coordinates, timestamps and elevation samples behind an exported track. View an exported GPX profile
What a saved trip contains
Everything below is computed when the drive ends and stored with it on the phone.
The route
Every accepted GPS fix with its speed, so the line can be recolored later without recomputing anything. Tunnels and overpasses are marked where the signal dropped.
Scores and grades
The overall driving score with its four components, plus safety, grip usage, ride comfort, road quality and energy efficiency.
Corners
Each corner with its direction, angle, rating, entry, apex and exit speed, lateral G and performance score, sorted with the best at the top.
Vehicle dynamics
Top speed, top corner speed, max acceleration and deceleration, peak G, and the 0-100 km/h time if the drive contained a launch. Left turns, right turns, lane changes and brake events are counted.
Trip info
Start and end city, duration, stopped time, pauses, elevation gain, and whether the recording ended cleanly or was recovered.
The history
Newest first, grouped by date, filterable to this week or this month. Each row shows time, distance, duration, top speed, corner count and the score.
Recording that survives the phone
Torq records in the background with the screen locked or another app open. Raw samples are written to disk as they arrive, so if iOS ends the app during a drive, the next launch finds the partial recording and offers to recover it, ending the trip at the last valid point, or to discard it. Nothing is lost silently.
Getting a trip out
Any trip can be shared as a GPX track, a CSV summary or the raw DPSE sensor file from its detail screen, through the iOS share sheet. The raw file imports back into Torq on another phone, which is how a drive moves to a new device.
Plan the next recording around your screen use and location settings. Choose settings for a longer recording
Questions
What does the trip replay show?
The route on a map with a marker that moves along it at 2x, 4x, 8x or 16x, the speed at the marker, elapsed time and distance, and the corners marked along the way. The route line is colored by speed and can be switched to road quality, G-force or elevation.
Is every drive saved automatically?
Every drive you start and stop is saved with its route, stats and analysis, on the phone. There is no cloud copy. Delete a trip from its detail screen, or delete them all by removing the app.
What is a speed heat map?
A route line whose color at each point is the speed there: blue for the slowest, cyan, yellow, and red for the fastest section of that drive. It makes the shape of a drive readable at a glance.
Can I look at the charts for a trip?
Yes. Under the map are a speed chart and an elevation chart against elapsed time, and a speed distribution in 20 km/h bands. Scrubbing the speed chart moves the map marker.
What if the app was closed mid-drive?
Recording continues in the background normally. If iOS terminates the app, the next launch offers to recover the drive from the data already written to disk, ending it at the last valid point, or to discard it.
Does trip replay need a network?
The route and all the data are on the phone. The map tiles under the route come from Apple Maps, so without a connection the route still draws over whatever tiles are cached.
Every drive, kept and replayable.
Start a drive, stop it, and it is on the map with its speed, its corners and its score. Come back to it whenever you like.