
A driving score app that shows its working.
Four components with published weights, three grades on scales road engineers use, and a profile of your driving habits and style once there are enough trips to draw one. Nothing is a black box, and nothing is shared with an insurer.
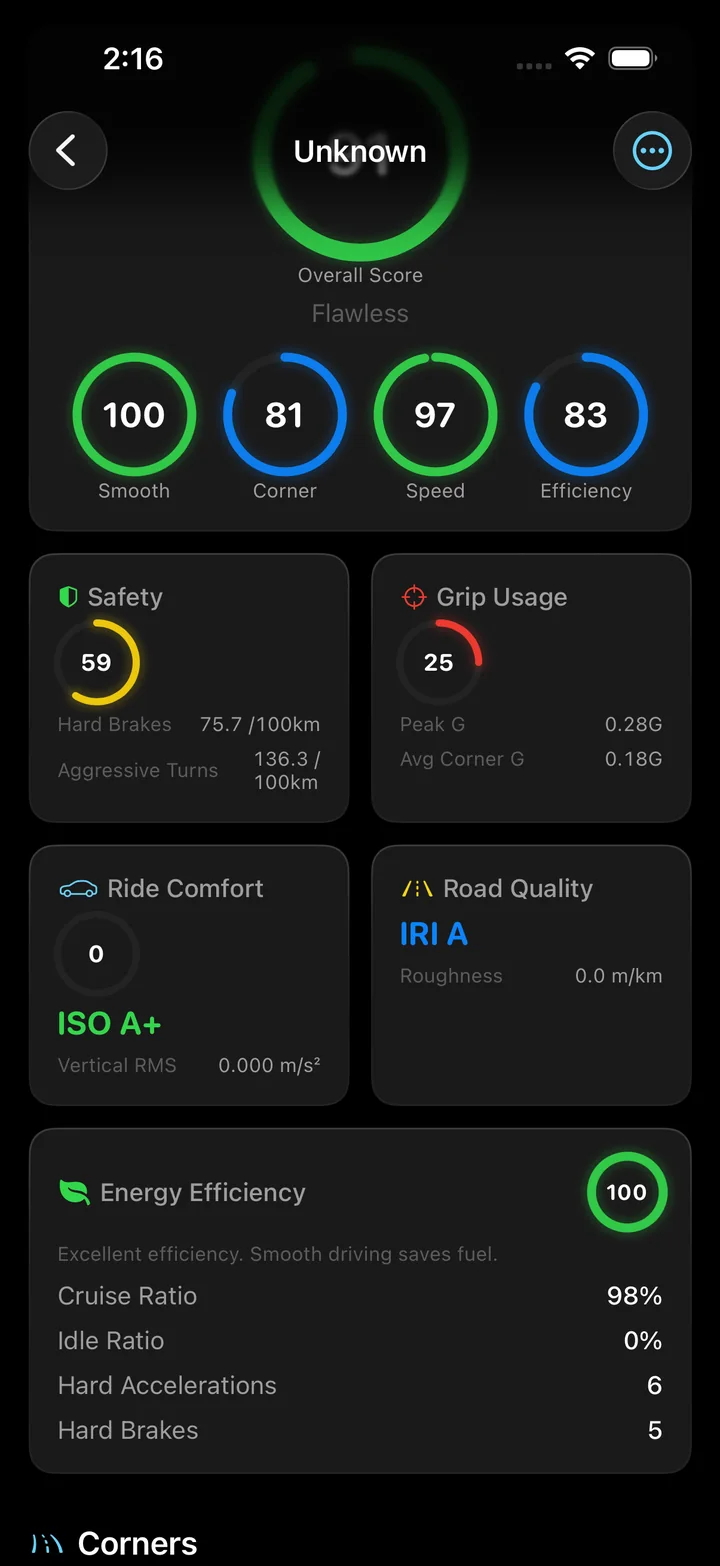
The four components
| Component | Weight | What it measures | What moves it |
|---|---|---|---|
| Smoothness | 30% | The 90th percentile of jerk, the rate of change of acceleration, over the moving part of the drive. | Sharp throttle and brake transitions. Calibrated so 2.5 m/s³, the ISO 15622 comfort ceiling, scores 50. |
| Cornering | 30% | The average of the per-corner performance scores, penalized for jerk inside corners. | Apex speed relative to entry, exit speed relative to apex, and lateral G held through the corner. |
| Speed control | 25% | The average absolute rate of speed change while moving, a proxy for speed variability. | Surging and hunting on a steady road. Traffic-forced changes count, so a jammed commute scores lower. |
| Efficiency | 15% | Cruise ratio, idle ratio, hard accelerations and speed variation, combined into an energy score. | Idles longer than 45 seconds, repeated hard launches, and a low share of time at steady speed. |
A component under 40 applies an extra penalty to the overall score, so one weak dimension shows through rather than hiding behind three good ones. The weights and thresholds are the ones the app ships with, and the research page lists the studies each formula is calibrated against.
Safety, comfort, road.
The score is about the driver. These three are about the drive, and two of them grade the road and the car as much as the person.
Safety counts hard brakes and aggressive turns per 100 km, so a long drive is not penalized for its length. Ride comfort is frequency-weighted vertical vibration on the ISO 2631-1 scale, from A+ under 0.315 m/s² to F over 2.0. Road quality is an IRI-style roughness index with highway thresholds above 50 km/h and more forgiving urban ones below.
A braking event has a speed change, a time interval and a road context. Read those together when reviewing a count. How harsh braking is counted
Six tags, one radar, after four trips.
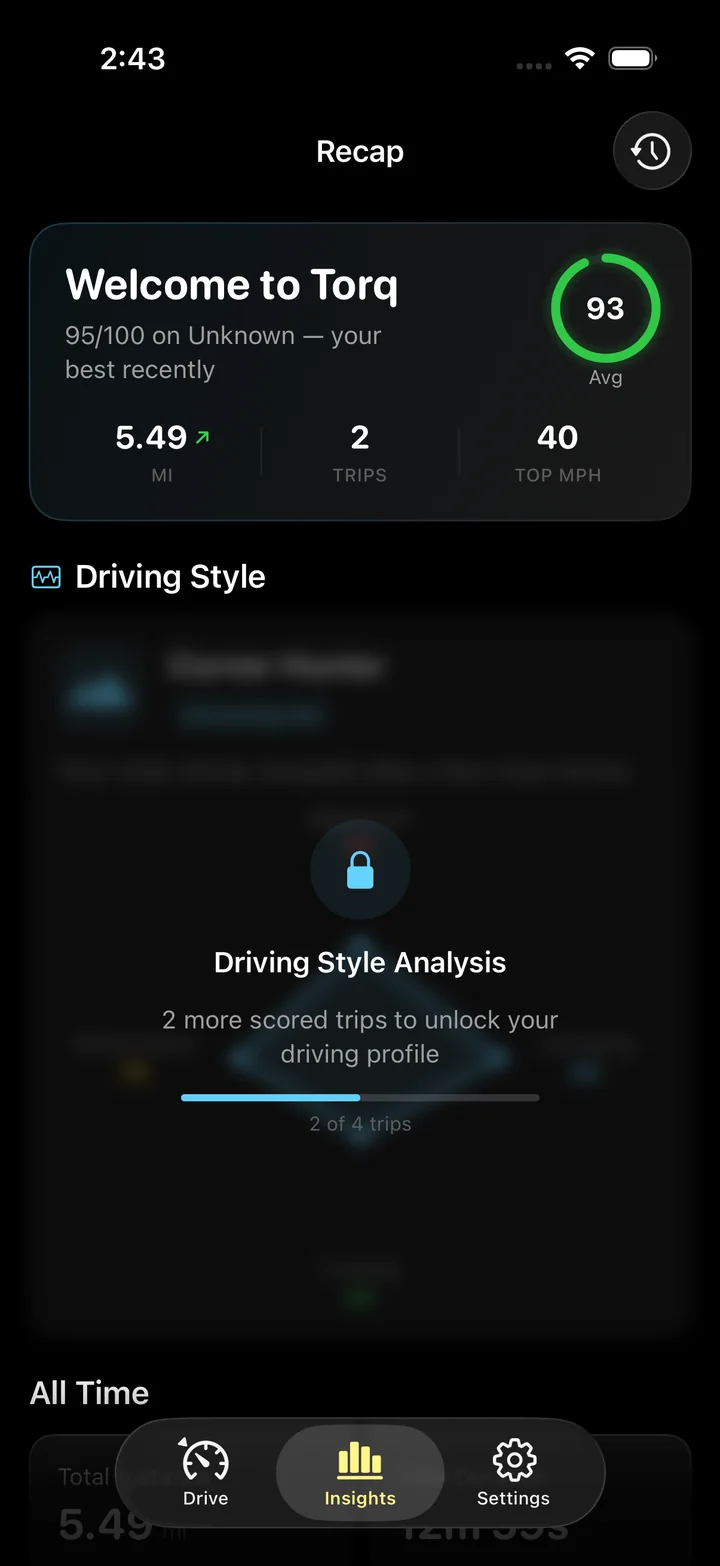
After four scored trips, the Recap tab draws a radar with four axes: aggression, cornering, cruising and performance. Aggression comes from the rate of hard events, cornering from the corner scores, cruising from the share of the drive at steady speed, performance from the speeds and accelerations reached.
The dominant axis gives the trait, and the shape gives one of six tags: Corner Hunter, Straight-Line Demon, Zen Cruiser, Veteran, All-Rounder or Thrill Seeker. A Zen Cruiser is not a better driver than a Corner Hunter; they are different shapes on the same chart, and the chart moves as the record grows.
Why the formulas are public
A score you cannot inspect is a score you cannot improve against. Every threshold in Torq's analysis is a named parameter, the research behind the smoothness, cornering and speed-control formulas is cited, and the data the score is computed from is exportable as a raw file. If you think a drive was scored wrong, you can check.
The same openness cuts the other way: the score is an informational figure from a phone's sensors, not a measurement of how safe a driver you are. GPS quality, phone placement and road conditions all move it.
Questions
What is a driving score, and how does Torq calculate it?
A single 0 to 100 number for a drive, built from four components: smoothness (30%), cornering (30%), speed control (25%) and energy efficiency (15%). Each component is its own formula on the GPS trace. If any component falls under 40 the overall score is reduced further.
Is this the kind of score an insurance company uses?
It uses some of the same signals, hard braking and harsh acceleration in particular, and the thresholds come from the same telematics research. But Torq is not an insurance product, shares scores with nobody, and its score rewards good cornering, which an insurer would not. It is a score for you.
What lowers my score most?
Harsh jerk. Smoothness is 30 percent of the score and is driven by the 90th percentile of jerk, so a drive with many sharp throttle and brake transitions loses points fastest. Long idles and repeated hard accelerations cost efficiency points. In corners, scrubbing speed late and exiting slower than you entered costs cornering points.
What is a good driving score?
On Torq's scale, 90 and above earns an A+, 80 an A, 65 a B, 50 a C. A calm highway drive with few stops typically lands in the 80s; a jammed city commute lands lower because traffic-forced speed changes count against speed control and efficiency.
What is a driving style profile?
After four scored trips, Torq plots four traits, aggression, cornering, cruising and performance, and assigns one of six tags. The tag summarizes the shape of the radar, not a judgment, and it moves as your record grows.
Can I see how my score changes over time?
Yes. The Recap tab shows the average score, a score trend and monthly figures across every scored trip, and each trip in the history carries its own score.
A score you can argue with.
Every component of the Torq driving score is a published formula on data you can export. Record a drive and read the working.